
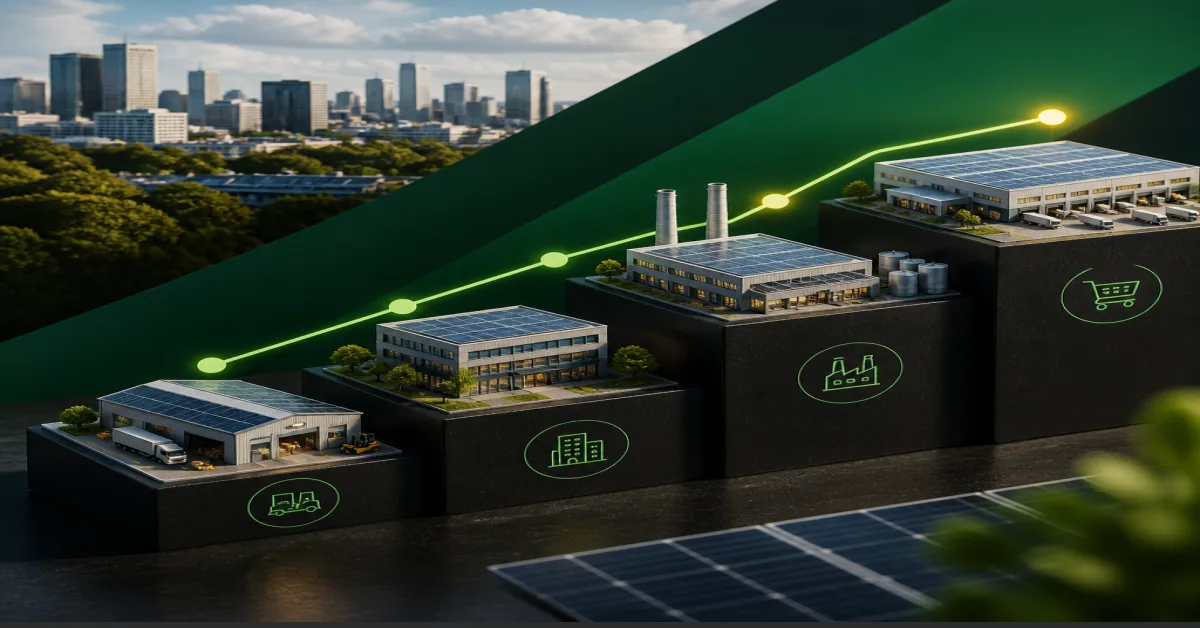
Commercial Solar Suitability: Compare Sector Payback & ROI
Compare commercial solar suitability across 11 sectors. View data on payback periods, annual savings, and CO2 reduction for warehouses, factories and more.
11 sectors
Ranked high to low fit
3.8 yr
Fastest typical payback
£156k/yr
Top typical annual savings
312 tCO2e
Top annual carbon saving
What's Covered on This Page
- What Commercial Solar Suitability Means (Roof, Load, Payback, Planning)
- Solar Suitability Scoreboard: Highest to Lowest Sector Fit
- Side-by-Side Sector Matrix: Typical System Size, Roof Area, and CO₂ Savings
- When BESS Belongs in the Typical Profile (Factories, Cold Storage, Stadiums)
- Mixed-Use Buildings and a Free Site Survey
- Frequently Asked Questions
Need Commercial Solar Suitability Advice?
0161 570 0596
Get A Free Quote. Bee Commercial Solar is ready to help.
What Commercial Solar Suitability Means (Roof, Load, Payback, Planning)
Commercial solar suitability is how well a non-domestic site's usable roof, daytime or 24/7 load profile, typical payback, and planning ease line up. It is not roof potential alone. This page ranks sectors using a composite model built on four axes: roof potential, load alignment, payback speed, and planning ease.
Scores can exceed 100 because this is a composite industry ranking, not a Sun Number-style 1–100 geospatial rooftop tool. All £ savings, kWh, payback years, and CO₂e figures on this page are typical or estimated profiles for each sector, not site-specific guarantees. Operations managers and C-suite readers should use this ranking to compare their building type against national averages before commissioning a detailed assessment.
Roof Potential
Usable south-facing or flat roof area for PV arrays, accounting for obstructions and structural limits.
Load Alignment
How well generation matches daytime or 24/7 electricity demand — the axis most often missed.
Payback Speed
Typical years to recover capital through bill savings, before any export income.
Planning Ease
Relative complexity of permitted development, grid connection, and building constraints.
Solar Suitability Scoreboard: Highest to Lowest Sector Fit
The ranked hierarchy below shows which sector profiles offer the strongest typical commercial fit, from highest to lowest composite score. Use it to identify which industry row is closest to your operating pattern and roof, then check the matrix for the physical size and carbon impact that goes with that rank.
1 — 120/100 • 5.1 years
Data Centre — £156,000/yr
24/7 cooling and server load align almost perfectly with generation; resilience needs push this to the top. This top ranking is reflected in our detailed guidance on data centre solar and storage.
2 — 110/100 • 5.2 years
Factory — £102,000/yr
High daytime production demand and large usable roof area; BESS covers shift peaks.
3 — 96/100 • 4.6 years
Cold Storage — £84,000/yr
Constant refrigeration load with strong roof coverage; storage smooths night-time draw.
4 — 94/100 • 3.8 years
Warehouse — £58,000/yr
Roof-as-revenue profile with excellent daytime load match and the fastest typical payback. The strength of this profile is why we detail warehouse solar installation as a key opportunity.
5 — 83/100 • 5.5 years
Stadium — £106,000/yr
Event-peak demand and large usable roof area; BESS bridges floodlight and match-day loads.
6 — 82/100 • 5.8 years
Healthcare — £92,000/yr
Continuous critical load, but slower payback due to complex planning and estate constraints.
7 — 75/100 • 4.2 years
Agriculture — £48,000/yr
Good roof potential on barns and outbuildings, lower absolute consumption.
8 — 72/100 • 4.5 years
Retail — £41,000/yr
Strong daytime match, smaller roof-to-load ratio than logistics property. This score is supported by evidence on retail solar viability in our sector guides.
9 — 63/100 • 4.8 years
Hospitality — £38,000/yr
Evening and weekend peaks reduce direct self-consumption without storage.
10 — 60/100 • 5.4 years
Schools — £28,000/yr
Seasonal load profile and budget constraints weaken the typical commercial case.
11 — 53/100 • 4.1 years
Office — £34,000/yr
Service charge and tenant split incentives weaken the direct case, despite a decent payback.
Offices and schools are the weakest typical fits, but both can still be survey-worthy if occupancy and usable roof diverge from the average. A lower-scoring office can outperform a high sector if its roof and energy data are strong. Factories, cold storage, and stadiums are high-load profiles where BESS appears in typical systems, detailed in the next section.
Side-by-Side Sector Matrix: Typical System Size, Roof Area, and CO₂ Savings
Figures below are typical or estimated commercial profiles, not site-specific quotes. Compare typical kWp, usable roof, annual generation, estimated savings, payback, and tonnes of CO₂e saved per year.
| Sector | Typical System Size | Roof Area Needed | Annual Generation | Annual Savings | Payback Period | CO₂ Saved / Year |
|---|---|---|---|---|---|---|
| Warehouse | 250 kWp | 4,200 m² | 225,000 kWh | £58,000 | 3.8 years | 78 tonnes CO2e |
| Factory | 500 kWp + 200 kWh BESS | 6,500 m² usable | 450,000 kWh | £102,000 | 5.2 years | 156 tonnes CO2e |
| Office | 150 kWp | 1,400 m² | 135,000 kWh | £34,000 | 4.1 years | 47 tonnes CO2e |
| Retail | 150 kWp | 1,400 m² | 135,000 kWh | £41,000 | 4.5 years | 47 tonnes CO2e |
| Cold storage | 350 kWp + 300 kWh BESS | 5,500 m² | 298,000 kWh | £84,000 | 4.6 years | 110 tonnes CO2e |
| Data centre | 1 MWp + 1 MWh BESS | 8,000 m² usable | 850,000 kWh | £156,000 | 5.1 years | 312 tonnes CO2e |
| Schools | 120 kWp | 1,800 m² | 108,000 kWh | £28,000 | 5.4 years | 36 tonnes CO2e |
| Healthcare | 300 kWp + 250 kWh BESS | 3,800 m² usable | 285,000 kWh | £92,000 | 5.8 years | 98 tonnes CO2e |
| Agriculture | 200 kWp | 2,800 m² | 190,000 kWh | £48,000 | 4.2 years | 65 tonnes CO2e |
| Hospitality | 150 kWp | 1,600 m² | 142,000 kWh | £38,000 | 4.8 years | 52 tonnes CO2e |
| Stadium | 500 kWp + 400 kWh BESS | 5,500 m² usable | 450,000 kWh | £106,000 | 5.5 years | 175 tonnes CO2e |
Note the distinction between total and usable roof area. Factory, data centre, healthcare, and stadium rows show "usable" roof because obstructions, structural limits, and plant equipment reduce available panel space. A common sizing mistake is treating an office like a warehouse based on roof m² alone; load profile must drive system size, not headline roof area. The fastest payback in the table (warehouse at 3.8 years) is not the highest score because the composite model also weighs load alignment and planning ease.
Mixed-use buildings will not sit cleanly on one row of this table. That is expected, and a free site survey is the correct way to resolve it. If your roof mix combines warehouse space with office or retail, the usable area and load profile will fall between rows — the survey measures the actual split.
When BESS Belongs in the Typical Profile (Factories, Cold Storage, Stadiums)
Battery Energy Storage Systems (BESS) are for load-shift and resilience on high or peaky demand profiles, not a default for every commercial roof. Storage is justified when generation and demand are misaligned in time — typically because consumption continues after dark, spikes on event days, or production shifts do not match solar output. In this dataset, BESS appears in the typical profile for five sectors: factories, cold storage, stadiums, data centres, and healthcare.
Factories (200 kWh typical)
Production spikes and shift patterns create windows where stored solar replaces peak grid draw, cutting both energy cost and demand charges. This is a prime example of factory solar in practice, where the financial case is reinforced by the operational savings from peak shaving.
Cold Storage (300 kWh typical)
24/7 cold storage refrigeration loads can absorb generation around the clock, but storage smooths night-time and reset peaks that would otherwise pull from the grid.
Stadiums (400 kWh typical)
Event-day and floodlight peaks far exceed daytime generation; storage covers the gap and guards against power interruptions during fixtures. These event-peak dynamics are central to how stadium solar systems are designed for resilience.
Data Centre & Healthcare
Data centre (1 MWh typical) and healthcare (250 kWh typical): table-consistent mentions for critical-load resilience, not additional promises.
Warehouses, retail, offices, schools, agriculture, and hospitality in this dataset are solar-only typical sizes. A large warehouse roof can still be a strong solar-only typical fit — the daytime picking and packing load absorbs generation directly — so adding BESS there is not a profile default. If your site falls into the solar-only group but has night shift operation or evening peaks, storage becomes a survey question rather than a standard inclusion.
Mixed-Use Buildings and a Free Site Survey
Many buildings span multiple uses, and a free site survey is the way to identify an optimal solar strategy regardless of sector. This service is for operations managers and C-suite executives qualifying commercial PV, and BESS where relevant, before design work begins. The scoreboard and matrix help you benchmark; the survey converts that benchmark into your site's specific numbers.
Problems the survey resolves:
Mixed-use buildings that do not match a single scoreboard row, such as warehouse-plus-office or retail-with-cold-storage.
Usable roof versus load mismatch, where total area overstates viable panel capacity due to plant, skylights, or structural limits.
Planning and export uncertainty at a high level, confirmed by site data rather than assumptions.
ESG carbon estimates replaced with actual meter data and real consumption patterns, so your reporting reflects measured usage.
The expected outcome is a site-specific solar strategy, not a table row used as a quote. Delivery follows a high-level process:
Site Survey
Measure usable roof, load profile and BESS need directly.
Design
Size array to meter data and occupancy hours.
Connection & Planning
Assess grid connection and planning pathway.
Installation
Install site-specific strategy, not a table row.
Scope is affected by occupancy hours, usable roof, and whether BESS is justified; the survey confirms all three. A mixed-use building may end up with a smaller array than its roof suggests because the load profile, not the roof area, sets the right size.
Book a Free Site Survey
Call 0161 570 0596 to confirm your project’s sector fit and design pathway. The survey resolves mixed-use blends, roof constraints, and whether storage earns its place before you commit to design.
Frequently Asked Questions
Frequently Asked Questions
What does commercial solar suitability mean compared with a 1–100 rooftop score?
Commercial solar suitability in this ranking is a composite industry model scored across roof potential, load alignment, payback speed, and planning ease. A 1–100 rooftop score from US mapping tools measures only geospatial roof irradiance for a specific parcel. This page ranks sectors, not postcodes, so scores can exceed 100. Use the sector rank to shortlist, then a survey to test your specific building.
What qualifies as commercial solar in the UK?
Commercial solar means any non-domestic PV system sized to a business's electricity demand and roof area, typically above residential scale. It covers warehouses, factories, offices, retail units, farms, schools, hospitals, and public buildings, and is assessed through a site survey rather than a standard residential kit. The array is designed around the building's load profile and usable roof, not a fixed domestic size.
Is there a single best solar system for commercial use?
No. The best system depends on sector load profile, usable roof, and whether BESS is justified. In this dataset, warehouses are strong solar-only fits, while factories, cold storage, and stadiums typically include BESS for load-shift and resilience. A survey determines the correct size and configuration because no two roofs or occupancy patterns are identical.
Should factories, cold storage, and stadiums include BESS?
Yes, in typical profiles. Factories usually pair a 500 kWp array with 200 kWh BESS, cold storage with 300 kWh, and stadiums with 400 kWh. Storage is recommended where generation and demand are misaligned in time, such as production spikes, 24/7 refrigeration, or event-day peaks. The matrix also shows BESS on data centre and healthcare rows because critical-load resilience is part of the typical design there.
Do the 33% and 120% rules apply to UK commercial solar projects?
Those figures appear in US interconnection and net metering contexts, not UK regulations. In the UK, export and connection limits are assessed site-specifically by the Distribution Network Operator and design engineer. A site survey confirms the actual connection and design constraints for your project, including any export cap that applies to your local network.
Can a lower-scoring sector such as offices or schools still be suitable?
Yes. Offices (53/100) and schools (60/100) are weaker typical fits because of service charge splits and seasonal load profiles, but strong roof orientation, usable area, and occupancy patterns can still justify a system. For offices, the specific barriers and solutions are explored in our analysis of office solar challenges. Similarly, school solar projects often work when the 8am-3pm demand peak is matched well, as detailed in our sector guide. A school with summer holiday loads may export more, which changes the payback calculation — the survey tests whether your actual data supports it.
How should mixed-use buildings use the sector comparison?
Mixed-use buildings should use the table as a reference, not a direct quote. If your site combines warehouse and office, or cold storage and retail, the typical row will not align exactly. A free site survey resolves the blend by measuring usable roof, load profile, and BESS need directly, producing a strategy specific to the mix rather than a single row.
Are the payback, savings, and CO₂ figures typical estimates or guarantees?
All payback years, annual £ savings, and CO₂e tonnes are typical or estimated commercial profiles, not guarantees. Actual results depend on roof condition, usable area, occupancy hours, electricity prices, and export arrangement. A site survey produces site-specific figures before any design commitment, so your project is sized to measured data rather than a sector average.
Ready to Compare Your Sector Fit?
We will survey your site, model your savings, and present a tailored proposal — no obligation, no pushy sales calls.
Call Now 0161 570 0596
Typical survey takes 45 minutes. Report delivered within 5 business days.